Analyzing Retail Investors with Robinhood Data

Palash Padliya

The United States Stock Market has historically been dominated by institutional investors. Historically 90% of trades and orders in the market were from Banks, Pension Funds, Insurance Companies etc.

However, that percent has slowly been declining as retail investors, like you and I are placing more and more orders. With the advent of commission-free trades, regular people are realizing that the market is an accessible way to make some money.

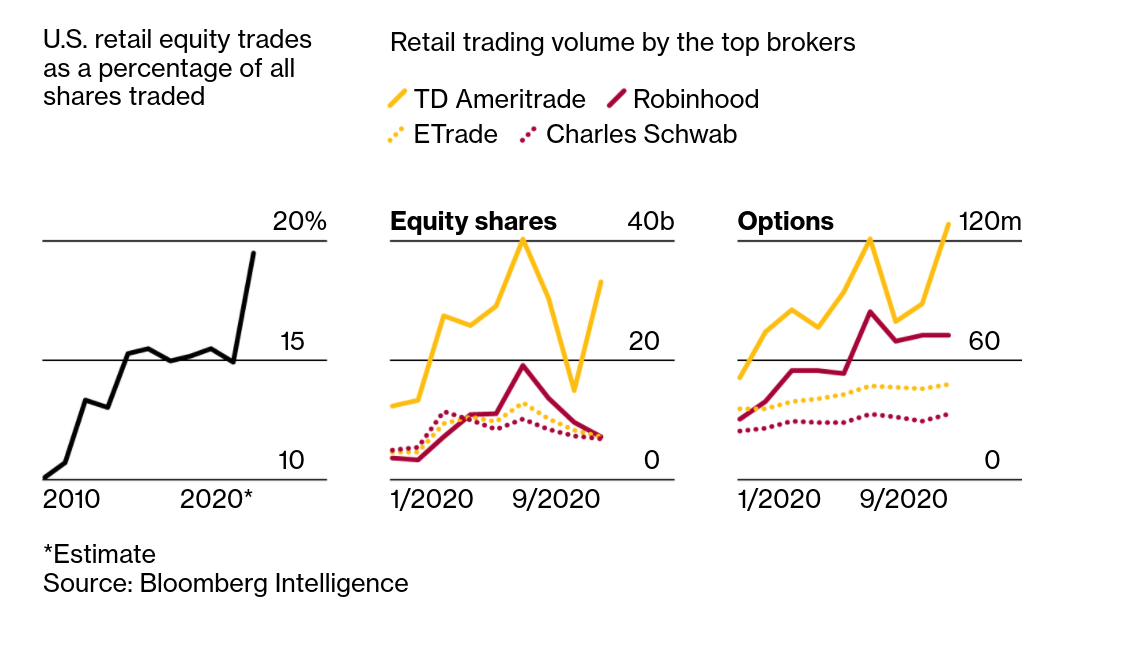
Recently, however, with the spread of COVID-19 and people staying at home, we've seen a huge surge in the number of trades (order flow) from Retail Investors. This is likely because people are finding more time, that used to be spent commuting and travelling, to invest (gamble ;) ) in the stock market. According to data from Larry R Tabb of Bloomberg Intelligence (1) retail investors now account for 19.5% of order flow.

As the percentage of retail investors grow, understanding their actions becomes more and more profitable. If one can predict their actions or atleast understand how they work then this is very profitable. Such research is similar to what Engineers, Data Scientists and Researchers at Quant Firms like Renaissance Two Sigma do to create their investing models. Sucess in such research has netted funds like Rennisance's Medalion Fund a return of 66% annualized without fees over a 30 year lifespan whereas the S&P 500 , the most common US Stock Market Index has only returned 10%.

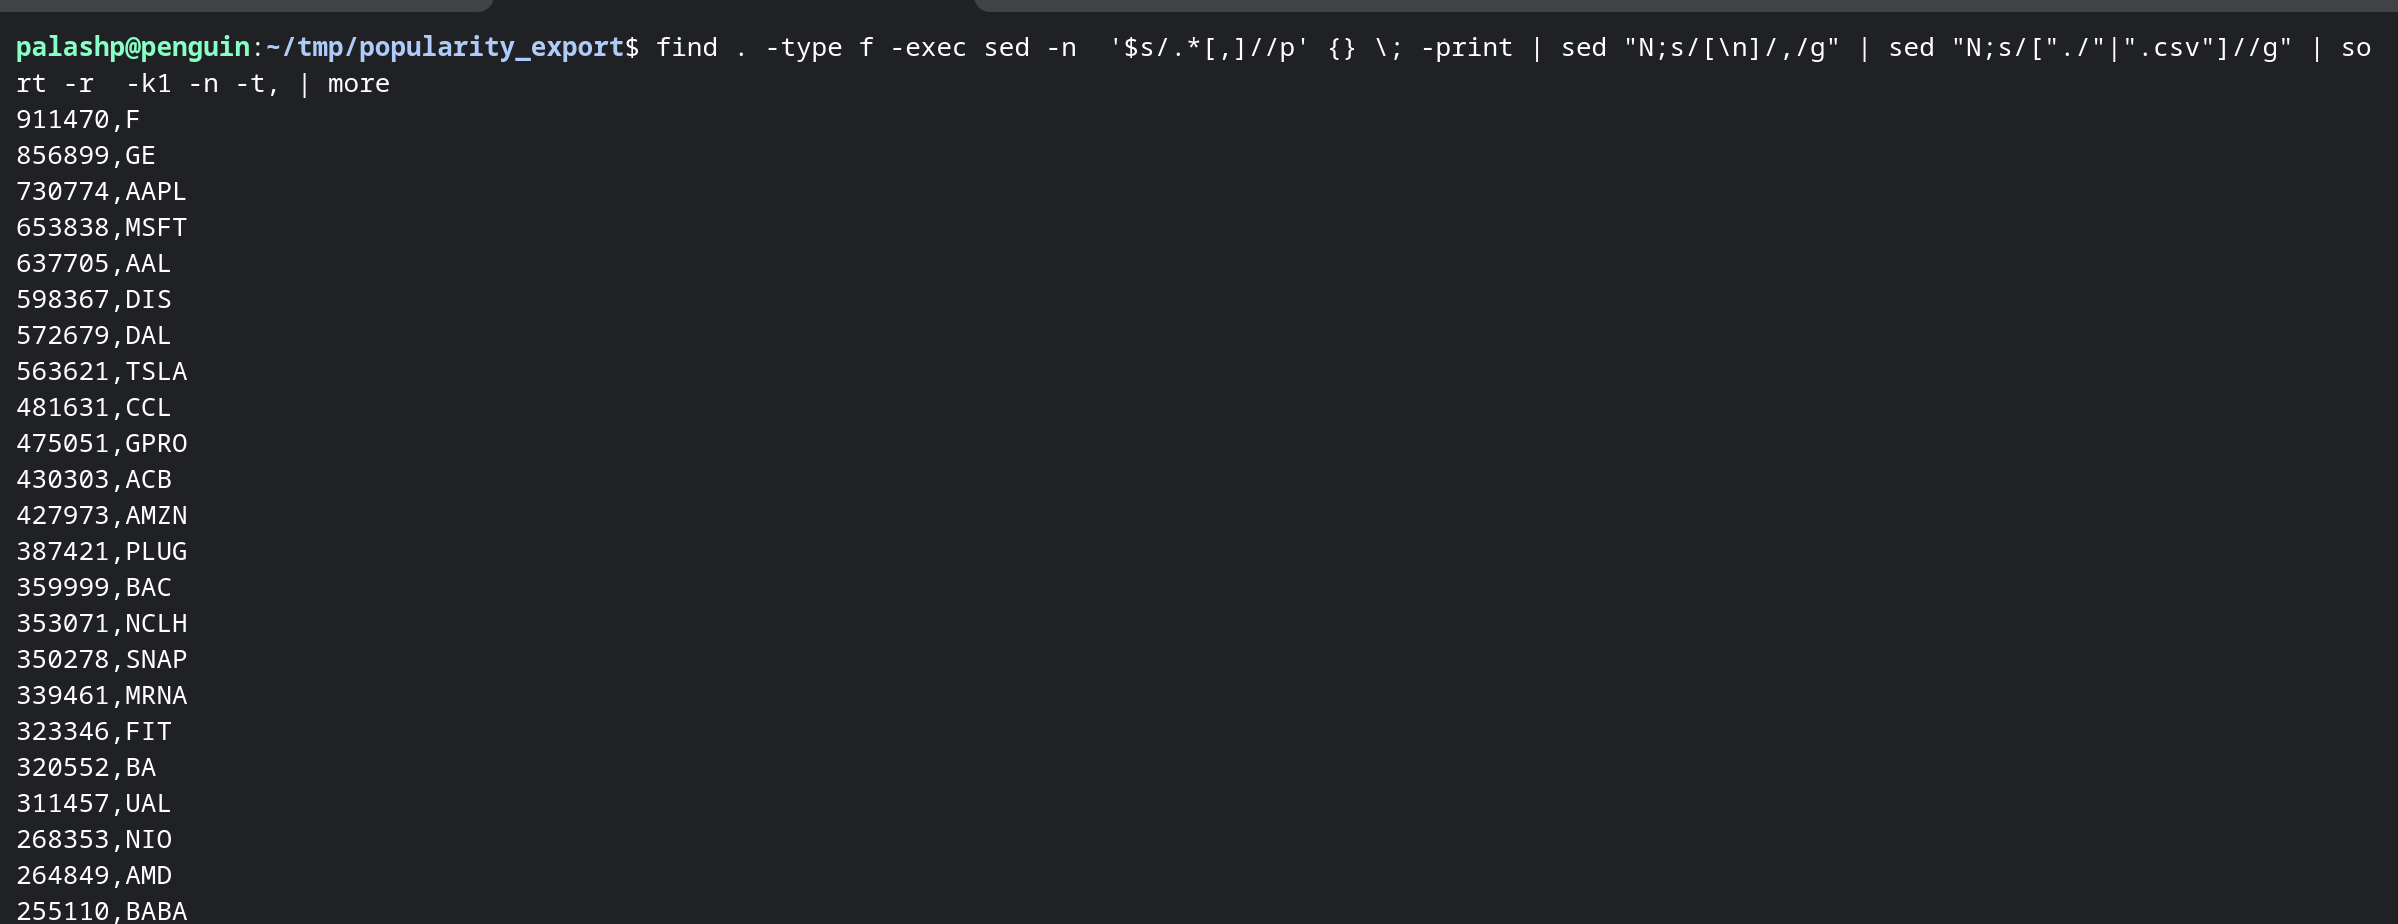
As can be seen by the chart above Robinhood is the second biggest choice of broker for retail investors. Until August 2020, Robinhood exported popularity data, which was captured and stored by the creators of RobinTrack. This dataset is a treasure trove because while it is easy to get information about trades in the market, it is hard to get data specifically about retail investors.

  1. https://www.bloomberg.com/news/articles/2020-12-02/the-future-of-finance-is-in-wealth-management-and-retail-trading

Downloading the Data

We downloaded the data from https://robintrack.net/data-download and untar the directory which seems like csv's of over >8000 stock tickers.

Reading the Data

Let's take a look at what the data about a specific ticker looks like by reading the first 5 and last 5 lines of Alcoa Corp (AA)'s csv.

The data looks like a list of timestamps and the number of robinhood users holding a stock.

Let's get the top 5 stocks that were being held by the robinhood users at the last timestamp available and try to better understand those stocks by importing them into this ipython notebook.

Data Cleanup & Visualization

Let's take a look at the top 5 stocks holidays from Aug 2020. From the above analysis, they are F - Ford GE - General Electric AAPL - Apple MSFT - Microsoft AAL - American Airlines

Let's plot the daily holdings by RobinHood users

Now let's look at the percent change over time

Let's also look at the stock prices for these stocks over time. We'll load them from the Yahoo Finance API and plot the chart

AAL here is quite interesting. There seems to have been a dip in the price, which has led to more people investing in the stock. This is opposite from what I would've assumed. As the stocks descrease the number of people holding the stock should decrease. Maybe this is because of the news cycle, as these stocks have been in the news and that has caused a rush of investors into American Airlines. Let's scrape some data from Google Trends to figure out if stocks are correlated to the number of searches for that type of stock.

It looks like the two charts are pretty well correlated. Let's get a correlation coefficient for each of the stocks.

Results

Based on the analysis above it seems like news cycle can be used to predict what stocks retail investors are likely to buy. The analysis from the top 5 stocks show with high confidence that there is some correlation. This is especially true of Ford and American Airlines which seems to be bought according to the news cycle. There are other factors in play, but Google Trends might be a very good signal for traders to figure out what is being bought and sold by retail investors.